FONTSIZE = 30
def plot_wall_times():
fig = plt.figure(figsize=(10,7))
ax = plt.subplot(111)
custom_color = {
"Dcorr" : "#377eb8",
"MGC" : "#e41a1c",
"Fast_Dcorr" : "#377eb8",
"HHG" : "#4daf4a"
}
test_name = [
"HHG",
"MGC",
"HHG_hhg",
"Dcorr",
"Dcorr_energy",
"Dcorr_kernlab",
"Fast_Dcorr",
]
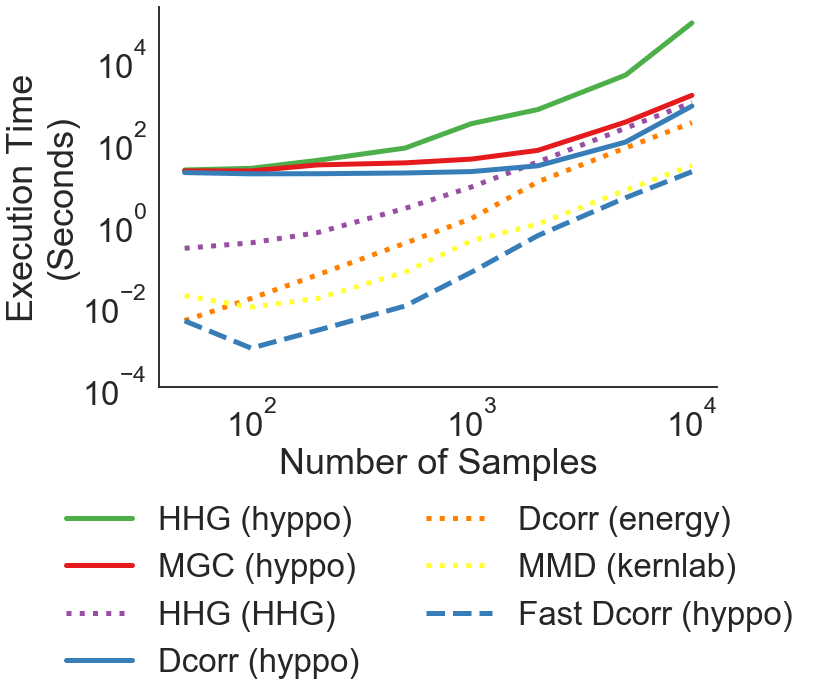
line_titles = [
"HHG (hyppo)",
"MGC (hyppo)",
"HHG (HHG)",
"Dcorr (hyppo)",
"Dcorr (energy)",
"MMD (kernlab)",
"Fast Dcorr (hyppo)",
]
i = 0
for name in test_name:
test_times = np.genfromtxt('../benchmarks/perf/{}.csv'.format(name), delimiter=',')
if name in ["Dcorr", "MGC", "HHG"]:
ax.plot(N, test_times, custom_color[name], label=line_titles[i], lw=5)
elif name in ["Fast_Dcorr"]:
ax.plot(N, test_times, color=custom_color[name], label=line_titles[i], lw=5, linestyle='dashed')
else:
ax.plot(N, test_times, label=line_titles[i], lw=5, linestyle="dotted")
i += 1
# x_dir = N[-1] + 3067
# ax.annotate("Fast MGC (mgc)", xy=(x_dir, 140), color="#e41a1c", fontsize=30)
# ax.annotate("Dcorr (energy)", xy=(x_dir, 50), color="#984ea3", fontsize=30)
# ax.annotate("Dcorr (kernlab)", xy=(x_dir, 22), color="#ff7f00", fontsize=30)
# ax.annotate("Fast Dcorr (mgc)", xy=(x_dir, 10), color="#377eb8", fontsize=30)
# ax.annotate("Dcorr (mgc)", xy=(x_dir, 500), color="#377eb8", fontsize=30)
# ax.annotate("MGC (mgc)", xy=(x_dir, 1380), color="#e41a1c", fontsize=30)
ax.spines['top'].set_visible(False)
ax.spines['right'].set_visible(False)
#ax.spines['bottom'].set_visible(False)
#ax.spines['left'].set_visible(False)
ax.set_xlabel('Number of Samples')
ax.set_ylabel('Execution Time\n(Seconds)')
ax.set_xscale('log')
ax.set_yscale('log')
ax.set_xticks([1e2, 1e3, 1e4])
ax.set_yticks([1e-4, 1e-2, 1e0, 1e2, 1e4])
leg = plt.legend(bbox_to_anchor=(0.5, -0.05), bbox_transform=plt.gcf().transFigure,
ncol=2, loc='upper center')
leg.get_frame().set_linewidth(0.0)
for legobj in leg.legendHandles:
legobj.set_linewidth(5.0)
plt.savefig('../benchmarks/figs/indep_wall_times.pdf', transparent=True, bbox_inches='tight')